AI Backlog Management Beyond Priority Fields
Rethink AI backlog management with dependency graphs. Learn how AuricIDE ranks tickets by structural leverage instead of manual priority fields.
A ticket marked critical sits at the top of the Tickets tab. Six other tickets wait behind a small one that nobody rated highly. The label says how much somebody cares. The dependencies say how much work is stuck.
That gap is where AI backlog management goes wrong whenever it only re-sorts labels. AuricIDE keeps a priority field that a person sets, and next to it a count that nobody sets: how many unfinished tickets wait on this one. When the two disagree, the count is the better guide to what to start next, because it measures delay while the label measures concern.
What does a backlog look like when the urgent ticket blocks nothing?
It looks like a Tickets tab where the loudest row is the wrong one. Picture an engineer who opens the Work rail, selects Tickets, and runs an eye down the priority icons. The critical ticket stands out. A large customer request sits behind it, a long comment thread, and a deadline that has everyone uneasy.
Farther down there is a small ticket about a shared requirement, and its flame badge reads 6. Six unfinished tickets depend on it. Nobody called it urgent.
The critical ticket has no flame, since nothing waits on it. Sort by priority. The real constraint stays exactly where it was.
That distinction matters in developer experience tooling, especially when several local agents work against the same project state. A fleet can start more tasks, but it still needs a sound way to decide which unfinished dependency deserves human attention.
Why not just keep the priority labels fresh?
Stale labels look like the problem. A model could update priorities and sort the list again. Stakeholder needs change. Old labels mislead. A fresh label is still an opinion. Raising the shared requirement's priority fixes the list after someone spots the delay. Recording the dependency shows every person and agent which work must finish first.
A person chooses a priority. The project records a dependency as a relationship between tickets. People can debate priority in a meeting. A dependency can stop work from starting.
Agents use the fields differently. When an agent asks AuricIDE for work, it gets the highest-priority open ticket with no unfinished dependencies. A critical ticket waiting on something gets skipped, and the high-priority ticket behind it gets picked. The agent filters out blocked tickets, then uses priority to choose among the tickets that are ready. Heat does not affect the pick. It tells a person that one modest ticket could release six others.
Scoring approaches have a place too. A qualitative case study at a single company, a study of backlog prioritization with agile and business metrics, reports that pairing a prioritization matrix with velocity, cycle time and lead time made delivery decisions more predictable. That supports better decisions. It does not say which unfinished ticket holds up the others, and a fresher label would not either.
Models do have a job in a backlog, just a different one. In a 2025 study, GenAI-enabled backlog grooming, Oftebro, Nguyen-Duc and Kemell built a Jira plug-in that used GPT-4o to detect duplicate issues and propose merges, deletions or new issues. The study reports 100 percent precision and a 45 percent cut in time-to-completion. That cleans up the ticket set. It does not say which unfinished ticket holds up the rest.
How does AuricIDE compute heat?
AuricIDE counts how many unfinished tickets depend on each unfinished ticket. That count is the ticket's heat. The backlog overview is an MCP tool for agents. People use the Tickets tab as the screen. The overview groups tickets by epic. It leaves out anything done, archived, or discarded. It also names the unfinished dependencies blocking each ticket. Each call computes the counts from current records, without asking a model to rank the tickets.
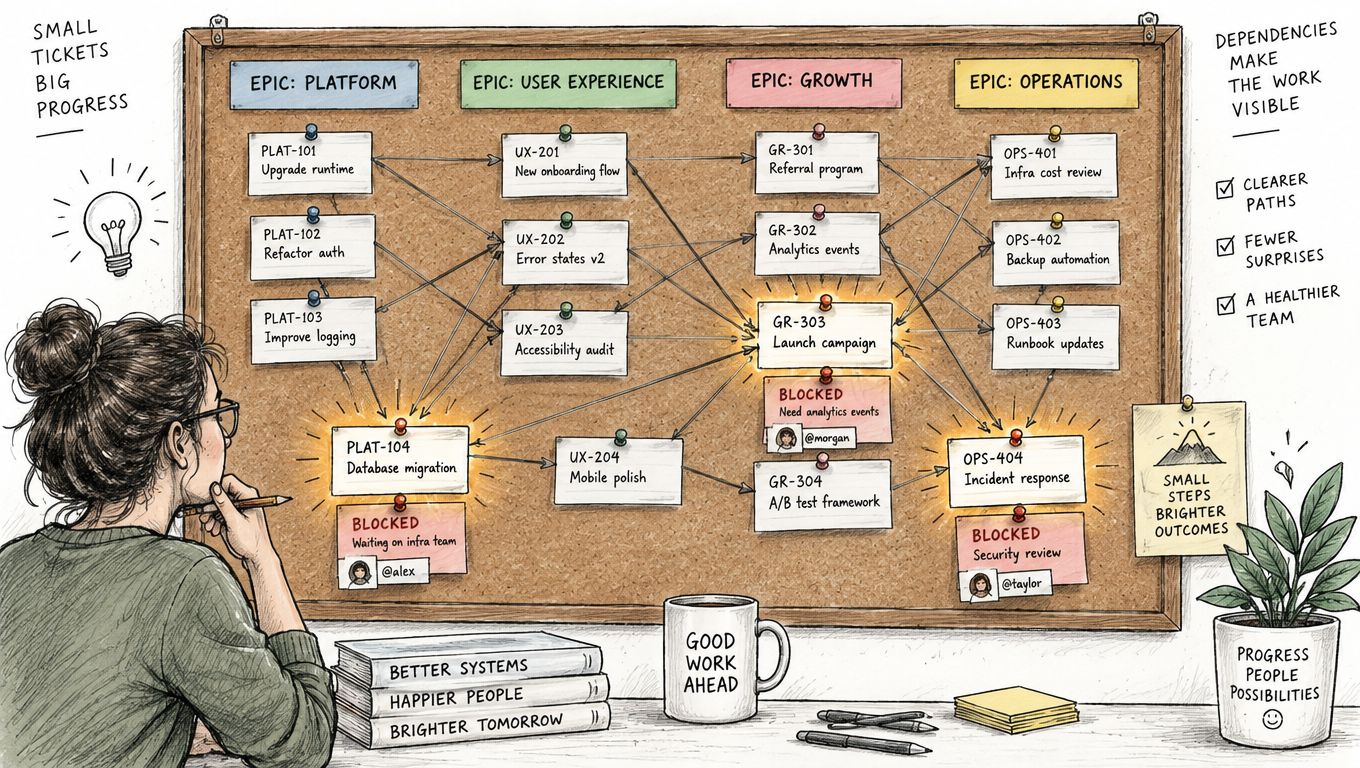
An arch gives a useful picture: removing its keystone releases several pieces at once. A brick painted red only shows where people are looking.
The flame badge shows the same count in the Tickets tab: green for 1-2, yellow for 3-4, orange for 5-9, and red for 10+.
The overview stays small on purpose, and its own description promises minimal detail for context efficiency. That matters in a fleet workflow, where an agent can update one ticket while another agent needs the current dependency picture through the MCP server workflow.
AuricIDE does not store heat. Stored heat would need updates after any ticket was added, removed, reopened, or reconnected. The overview reads the dependency records during each call, so its count matches the current graph. Those records live in a local project folder beside the goals, tickets, requirements, and test cases. No scoring service ever sees the graph.
Where do goals and finished tickets fit in?
A ticket can be created inside an epic and linked to a goal in the same step. It counts toward that goal's satisfaction from the start. It stops being a loose task. It becomes one condition that the larger outcome waits on.
That relationship changes how the overview gets read in a broader developer workflow. The dependency count can show one ticket blocking several others. Goal links also show when a ticket with no dependents supplies the last condition a goal needs. The overview keeps blocked work and product meaning visible.
Cleanup needs no separate step. A done ticket leaves the overview at once, and tickets done for more than a day get archived when the project next loads. Finished work stops competing. Tickets that can still delay delivery get the attention.
What does counting dependents cost?
Counting dependents costs a second signal to read. Priority and heat stay separate fields. The overview does not combine them into one rank. A ticket can have high heat and low visible urgency. Another can dominate planning meetings while blocking no work. A combined score gives a neater list. It also hides a decision that still belongs to a person.
Attention is the scarce part. Faros AI's July 2025 report on engineering telemetry found that developers on teams with high AI adoption complete 21% more tasks and merge 98% more pull requests, while pull request review time rises 91% (The AI Productivity Paradox). With that much more work landing on people, a second signal has to earn its place by pointing at the one ticket worth their time.
The count is only as good as the dependencies somebody recorded. A real blocker that nobody linked shows up as heat 0, and a link that should not exist inflates the badge. The overview cannot spot either mistake. In a small project with few dependencies, keeping the links current may cost more attention than the badge gives back.
The overview cannot judge whether a blocker is safe to build. It cannot decide whether a goal should change or a customer deadline should outweigh structural pull. It does not estimate or assign tickets. Those decisions stay with the people who know the product and its risks.
What should you ask of any backlog score?
Ask where the number comes from. A priority field records a judgment, and a dependency graph records which tickets cannot proceed until somebody finishes the one in front of them. The first explains urgency. The second shows where work is held up.
The same three questions work in any tool that claims to know what comes next. Who or what set the value? When was it last refreshed? Can the view name the work that is still blocked behind the item? A score that answers none of them is an opinion with a number on it.